


")


Geological maps are important tools used by geologists to represent the distribution and characteristics of rocks and geological features on the Earth’s surface. These maps are essential for understanding the geological history, tectonic processes, and natural resources of a given area.

Here are some key topics related to geological maps:
- Definition and purpose of geological maps: Geological maps provide a visual representation of the geology of a region, including rock types, faults, folds, and other geological features. The purpose of these maps is to help geologists understand the geological history and structure of a given area, which can be used for a variety of purposes, such as mineral exploration, natural resource management, and hazard assessment.
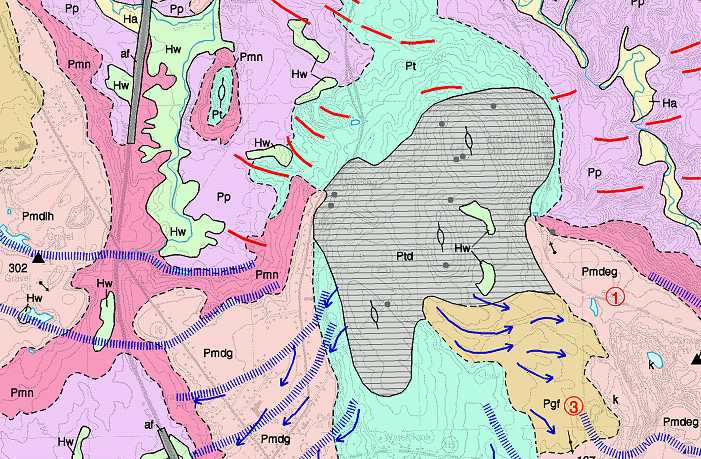
- Map symbols and conventions: Geological maps use a variety of symbols and conventions to represent different geological features. These symbols can include colors, patterns, and line types, which represent different rock types, faults, folds, and other features.
- Scale and accuracy: Geological maps are created at different scales, depending on the size of the area being studied. The accuracy of these maps is also an important consideration, as errors or inaccuracies can have significant implications for natural resource management, hazard assessment, and engineering projects.
- Interpretation and analysis: Once a geological map has been created, it must be interpreted and analyzed in order to gain a deeper understanding of the geology of the region. This can involve identifying relationships between different rock types, faults, and folds, as well as analyzing the spatial distribution and orientation of geological features.
- Applications of geological maps: Geological maps have a wide range of applications, including mineral exploration, natural resource management, hazard assessment, and engineering projects. These maps can also be used to help scientists better understand the geological history and evolution of the Earth.
- Limitations and challenges: Geological maps have some limitations and challenges, including the difficulty of accurately representing complex geological features, the need for accurate data and field observations, and the potential for errors and inaccuracies.
Overall, geological maps are an important tool for geologists and other scientists to understand the structure and history of the Earth’s surface. These maps can provide valuable insights into natural resource management, hazard assessment, and engineering projects, and can help scientists gain a better understanding of the geological processes that have shaped our planet.as
Brief history of geological maps
The history of geological maps can be traced back to the late 18th century, when geologists began to map out the geology of various regions. One of the earliest geological maps was created by William Smith in 1815, which depicted the rock layers and coal seams in England and Wales.
During the 19th century, geological maps became more sophisticated, and were used to study the structure and distribution of rocks and minerals around the world. One notable example is the geological map of France, created by Élie de Beaumont and colleagues in the 1840s, which showed the complex folding and faulting of the rocks in the region.
In the early 20th century, advancements in technology, such as aerial photography and seismic surveys, allowed geologists to create more accurate and detailed geological maps. The development of computers in the latter half of the 20th century further revolutionized the field, allowing for the creation of digital geological maps and 3D models of the subsurface.
Today, geological maps are an essential tool for geologists and other earth scientists, providing crucial information about the distribution of rocks, minerals, and resources, as well as the potential for earthquakes, landslides, and other natural hazards.
Types of Geological Maps
There are several types of geological maps, each designed to provide specific information about the geology of a particular area. Some of the most common types of geological maps include:
- Bedrock maps: These maps show the location and distribution of different types of rock formations at or near the Earth’s surface. Bedrock maps can be used to identify the age, composition, and structure of rocks in an area, as well as their potential for use as natural resources.
- Surficial maps: These maps show the distribution of different types of surficial materials, such as soils, sediments, and glacial deposits. Surficial maps can be used to study the history of climate change, the location of natural resources like water and minerals, and the potential for soil erosion and landslides.
- Structural maps: These maps show the orientation and location of different types of geologic structures, such as faults and folds. Structural maps can be used to study the history of tectonic activity in an area, as well as the potential for earthquakes and other natural hazards.
- Mineral maps: These maps show the location and distribution of different types of minerals and mineral resources in an area. Mineral maps can be used to study the geology of an area, as well as the potential for economic development through mining and other resource extraction.
- Geologic hazard maps: These maps show the potential for natural hazards, such as earthquakes, landslides, and volcanic eruptions, in an area. Geologic hazard maps can be used to identify areas that are at risk for these types of events, as well as to develop strategies for mitigating their effects.
These are just a few examples of the many types of geological maps that are used by geologists and other earth scientists to study the geology of our planet. Each type of map provides valuable information about the Earth’s history, composition, and structure, and can be used to inform a wide range of scientific and practical applications.
Components of Geological Maps

The components of geological maps typically include:
- Legend/key: A list or diagram that explains the symbols and colors used on the map, including rock formations, geological structures, and other features.
- Scale: A ratio or bar scale that indicates the relationship between distances on the map and actual distances on the ground.
- North arrow: A symbol that shows the orientation of the map, usually pointing to true north.
- Contour lines: Lines that connect points of equal elevation, used to depict the topography of the area.
- Geologic formations: Different rock units that are shown using distinctive colors or patterns, with each formation labeled according to its age and type.
- Structural features: Faults, folds, and other features that show how the rock layers have been deformed over time.
- Cultural features: Roads, buildings, and other man-made features that are included on the map.
- Grid lines: Lines that divide the map into sections to help with navigation and measurement.
- Marginal information: Additional information about the map, such as the date it was created, the name of the geologist who made it, and the source of the data used to create it.
- Explanatory notes: Additional information about the geology of the area, including the geological history, mineral resources, and other relevant details.
Interpreting Geological Maps
Interpreting geological maps is an important skill for geologists, engineers, and anyone working with the Earth’s surface. Here are some of the key components and techniques used in interpreting geological maps:
:max_bytes(150000):strip_icc()/usgs-contour-diagram-58b59f683df78cdcd878a7e3.jpg)
- Legend: The legend of a geological map provides the key for interpreting the various symbols and colors on the map. This includes symbols for rock types, geological features, and man-made structures.
- Stratigraphy: Understanding the stratigraphy of an area is essential for interpreting a geological map. This includes the age, composition, and arrangement of the rock layers in the area.
- Topography: Topographic features, such as hills, valleys, and ridges, are important in interpreting geological maps. These features can provide information about the geologic history of an area, as well as its current geological processes.
- Structural geology: Understanding the structural geology of an area is also important for interpreting geological maps. This includes the orientation and geometry of faults, folds, and other structural features in the rocks.
- Cross sections: Cross sections are often included on geological maps and provide a vertical slice through the geology of an area. They can help to visualize the geologic features and relationships in three dimensions.
- Field observations: Field observations are an important part of interpreting geological maps. This includes examining the rock types, structures, and features in the field and comparing them to what is shown on the map.
- Geologic history: Interpreting geological maps also involves understanding the geologic history of an area. This includes understanding the processes that have shaped the landscape, such as erosion, deposition, and tectonic activity.
Overall, interpreting geological maps requires a combination of knowledge and skills, including understanding of geology, topography, and structural geology, as well as field observations and the ability to visualize geologic features in three dimensions.
Making Geological Maps
Making geological maps is a complex and multi-stage process that involves a variety of techniques and tools. Here are some of the key steps involved in making geological maps:
- Collecting data: The first step in making a geological map is to collect data about the area being mapped. This typically involves fieldwork, including mapping rock outcrops, taking measurements of the rock properties, and collecting samples for laboratory analysis.
- Preparing base maps: Once the data has been collected, a base map is prepared, which typically includes topographic features such as contour lines, roads, and rivers. This base map provides a framework for the geological map and helps to locate the geological features accurately.
- Creating the geological map: The geological map is created by overlaying the geological data onto the base map. This involves drawing lines and symbols to represent the different rock types, geological structures, and other features of interest. Different colors and symbols are used to represent different types of rock formations, faults, folds, and other geological features.
- Compiling the map: Once the geological map has been created, it needs to be compiled, which involves preparing a final copy of the map that is suitable for publication or presentation. This may involve digitizing the map, adding labels and legends, and ensuring that the map is accurate and easy to read.
- Interpretation and analysis: Once the map has been compiled, it can be used for interpretation and analysis. Geologists use geological maps to understand the geology of an area, to identify potential mineral deposits, and to plan geological surveys and exploration activities.
Overall, making a geological map is a complex process that requires a combination of fieldwork, data collection, and interpretation skills. It is an essential tool for geologists and other professionals who work in the field of earth sciences.
Applications of Geological Maps
Geological maps have a wide range of applications in various fields, including:

- Resource exploration: Geological maps can be used to identify areas with potential mineral resources, such as metals, coal, and oil.
- Engineering and construction: Geological maps are used to assess the geologic hazards associated with an area, such as landslides, sinkholes, and seismic activity. This information is essential for designing safe and effective infrastructure.
- Environmental management: Geological maps are used to identify areas with potential environmental hazards, such as contaminated soil and groundwater, and to assess the impact of human activities on natural resources.
- Agriculture: Geological maps can help farmers understand the characteristics of the soil in their area, including its texture, drainage, and nutrient content. This information is important for crop selection and management.
- Education and research: Geological maps are used in education and research to teach and study the geology of an area, including its rock formations, fossils, and geologic history.
Overall, geological maps are essential tools for understanding the geology of an area and for making informed decisions about resource management, engineering design, and environmental protection.
Summary of key point Geological Maps
Here’s a summary of the key points about geological maps:
- Geological maps are maps that represent the distribution and properties of rocks and geological features on the Earth’s surface.
- Geological maps can be used to understand the geology of an area, identify natural resources, plan engineering projects, and more.
- The history of geological mapping dates back to the 18th century, when geologists began to recognize the importance of studying rock formations in a systematic way.
- There are several types of geological maps, including bedrock maps, geological hazard maps, and mineral resource maps.
- The components of geological maps include the map legend, map scale, map projection, and map symbols.
- Interpreting geological maps requires an understanding of the legend and symbols used on the map, as well as knowledge of the geology of the area being mapped.
- Making geological maps involves collecting data through fieldwork, creating geological cross-sections, and compiling the data into a map using geographic information systems (GIS) software.
- Applications of geological maps include natural resource exploration, environmental management, land-use planning, and hazard mitigation.
- The accuracy and reliability of geological maps can be improved through the use of advanced technologies such as remote sensing, geophysical surveys, and geochronology.
FAQ in Geological Maps
What is a geological map?
A geological map is a specialized type of map that displays the distribution of geological features and materials on or below the Earth’s surface. It is typically created by geologists and other earth scientists to represent the geology of a particular area, and can show the location, type, and age of rock formations, as well as the presence of faults, folds, mineral deposits, and other geological features. Geological maps are an essential tool in geological research, mineral exploration, and natural resource management, as they provide valuable information about the structure and composition of the Earth’s crust.
What is the purpose of a geological map?
The primary purpose of a geological map is to provide a visual representation of the distribution of different rock types, structures, and other geological features across a particular area. This information is essential for many different types of geological studies, such as mineral exploration, oil and gas exploration, groundwater management, and engineering geology.
Geological maps can also be used to identify potential hazards such as landslides, earthquakes, and volcanic eruptions. By understanding the geological history and structure of an area, scientists can make predictions about the likelihood of these hazards occurring, and take steps to mitigate their potential impact.
In addition to these scientific applications, geological maps can also be useful for land-use planning, environmental management, and other practical applications. For example, a geological map can help identify areas where it may be safe to build structures or where groundwater resources may be located.
Overall, geological maps are a crucial tool for understanding the Earth’s surface and subsurface, and for making informed decisions about natural resource management, hazard mitigation, and environmental protection.
What are the colors on a geological map?
The colors on a geological map represent different types of rocks, geologic units, or other features of the Earth’s surface. Each color corresponds to a specific type of rock or geologic unit, and is usually accompanied by a legend or key that explains the meaning of the colors. For example, red might represent sandstone, green might represent shale, and yellow might represent limestone. Other colors may be used to represent faults, folds, or other structural features. The colors used on a geological map are standardized and are often consistent across different maps in the same region or country.
How do you read a geological map?
To read a geological map, follow these general steps:
- Read the map legend: The map legend explains the symbols, colors, and patterns used on the map to represent different rock types, geologic features, and other information.
- Identify rock types: Look for areas on the map that are colored or patterned differently, indicating different rock types. Pay attention to the map key to understand what each color or pattern represents.
- Determine geologic structures: Look for features such as folds, faults, and joints, which are often represented by lines or patterns on the map. These structures can give insights into the deformation history of the rocks.
- Locate key features: Identify the locations of features such as mines, wells, outcrops, and geologic formations, which can provide important context for understanding the geology of the area.
- Consider the scale and projection of the map: Geological maps can vary in scale and projection, which can affect the level of detail and accuracy of the information presented. It is important to understand the limitations and potential biases of the map.
- Interpret the geologic history: Based on the information gathered from the map, attempt to reconstruct the geologic history of the area, including the types of rocks present, the sequence of events, and the forces that shaped the landscape.
What is a geological cross-section?
A geological cross-section is a two-dimensional representation of the subsurface geology of an area. It shows the vertical arrangement of the rock layers and other geological features beneath the Earth’s surface. Cross-sections are typically constructed by combining information from geological maps, boreholes, and geophysical data. They are commonly used by geologists to visualize the geology of an area and to help understand the spatial relationships between different rock units and geological features. Cross-sections can also be used to estimate the thickness and depth of rock layers, and to identify potential geological hazards such as faults or unstable ground conditions.
How are geological maps made?
Geological maps are made using a combination of fieldwork, data collection, and cartographic techniques. The process typically involves several steps:
- Fieldwork: Geologists conduct fieldwork to observe and record the physical characteristics of the rocks and sediment in the area. They collect samples, measure geological structures, and take notes on the location and orientation of rock formations.
- Data collection: Geologists collect various data about the rocks and sediment in the area, such as their age, composition, and characteristics. They may use a variety of techniques to gather this data, including radiometric dating, seismic surveys, and drilling.
- Interpretation: Based on the data collected in the field, geologists interpret the geological history of the area. They develop hypotheses about the depositional environment, tectonic activity, and other factors that have influenced the formation and deformation of the rocks.
- Cartography: Using specialized software and mapping techniques, geologists create a map that represents the geology of the area. This typically involves creating a base map with topographic features, then adding geological features such as rock formations, faults, and folds.
- Validation: Once the map is complete, geologists may validate their interpretations through additional fieldwork, data collection, and analysis. They may also compare their map to existing geological maps of the area to ensure consistency and accuracy.
What is the difference between a topographic map and a geological map?
A topographic map shows the surface features of the Earth’s land and is used to represent elevation and relief, while a geological map shows the distribution of rock types, faults, folds, and other geological features. While a topographic map provides information about the physical landscape of an area, a geological map provides information about the underlying geology and is used to study the geological history of an area. Additionally, topographic maps typically use contour lines to represent elevation, while geological maps use colors and symbols to represent different types of rocks and geological features.
What do contour lines on a geological map represent?
Contour lines on a geological map represent the elevation or height of the land surface above a reference datum. The contour lines connect points of equal elevation, and their spacing indicates the steepness of the terrain. In contrast, geologic features, such as rock formations, faults, and folds, are typically shown on geological maps using symbols, colors, and patterns. While both topographic and geological maps are important for understanding the landscape and underlying geology, they serve different purposes and convey different types of information.
What is a geological legend?
A geological legend, also known as a map legend, is a key or guide that provides information about the symbols and colors used on a geological map. It is an important component of the map that helps users understand the geological features and phenomena represented on the map. The legend typically includes a list of symbols and colors used on the map along with a brief explanation of what they represent. Some legends may also include a scale bar, north arrow, and other important information necessary to interpret the map accurately.
What is a geological fault on a map?
A geological fault on a map is a representation of a fracture or a zone of fractures in the Earth’s crust along which there has been displacement of the rock masses on either side of the fracture. Faults can be identified on geological maps by specific symbols or lines that indicate the location and orientation of the fault. The type of fault, such as normal, reverse, or strike-slip, can also be indicated on the map legend. Understanding the location and nature of faults is important in many geological studies, as they can have a significant impact on the structure, mineralization, and seismic activity of the Earth’s crust.
What is a geological map unit?
A geological map unit is a distinct geological formation or rock unit that is identified and represented on a geological map with a unique symbol and color. Each map unit is defined based on its lithology, age, and other geological characteristics, and is distinguished from the surrounding map units by its unique properties. Map units are used to describe the spatial distribution of geological materials on the surface of the Earth, and are an important tool for geologists in understanding the geology of a region and the processes that have shaped it over time. By analyzing the distribution and relationships between different map units, geologists can identify geological structures and make interpretations about the tectonic history and geological evolution of a region.
What is a strike and dip on a geological map?
On a geological map, strike and dip are used to represent the orientation of rock layers or geological features. Strike is the compass direction of a horizontal line on the surface of the rock layer, while dip is the angle of the layer from the horizontal plane. Strike is measured in degrees relative to north, while dip is measured in degrees relative to the horizontal plane. Together, strike and dip provide a 3D orientation of the rock layer, which can be important for understanding the geology and geological structures in an area.
What is a geologic contact on a map?
A geologic contact on a map refers to the boundary between two different rock units or geological features. It represents the place where the two different types of rock or geologic features meet, and can be depicted on a geological map as a line or boundary. The contact can be either conformable, meaning that the rocks or features on either side of the contact are parallel and similar in age, or unconformable, meaning that there is a time gap between the two units or features, often due to erosion or non-deposition of sedimentary layers. The contact can also show evidence of deformation, such as folding or faulting, which provides valuable information for understanding the geological history of the area.
Reference Lists
- United States Geological Survey (USGS) Geologic Maps: A comprehensive collection of geologic maps covering the United States, including topographic maps and mineral resource maps.
- British Geological Survey (BGS) Geological Maps: A series of geological maps covering the United Kingdom and its surrounding waters, including geological maps of Great Britain, Northern Ireland, and the Irish Sea.
- Geological Survey of Canada (GSC) Maps: A collection of geologic maps covering Canada and its surrounding waters, including geological maps of each province and territory.
- Geologic Map of the World (GMW): A global-scale geologic map produced by the Commission for the Geological Map of the World (CGMW), which aims to create a uniform global geologic map.
- OpenStreetMap: A collaborative online mapping project that includes geologic features, such as fault lines, rock formations, and mining sites.
- Google Earth: An online platform that provides satellite imagery and aerial photography of the earth’s surface, including geologic features.
- National Geographic Atlas of the World: A comprehensive world atlas that includes maps of the earth’s surface and geological features, such as tectonic plates and volcanic hotspots.
- World Digital Library: An online database of cultural heritage materials from libraries, archives, and museums around the world, including historical geological maps.
- Geologic Atlas of Texas: A series of geologic maps covering the state of Texas, produced by the Bureau of Economic Geology at the University of Texas at Austin.
- Geologic Map of Arizona: A comprehensive geologic map of the state of Arizona, produced by the Arizona Geological Survey.


