


")


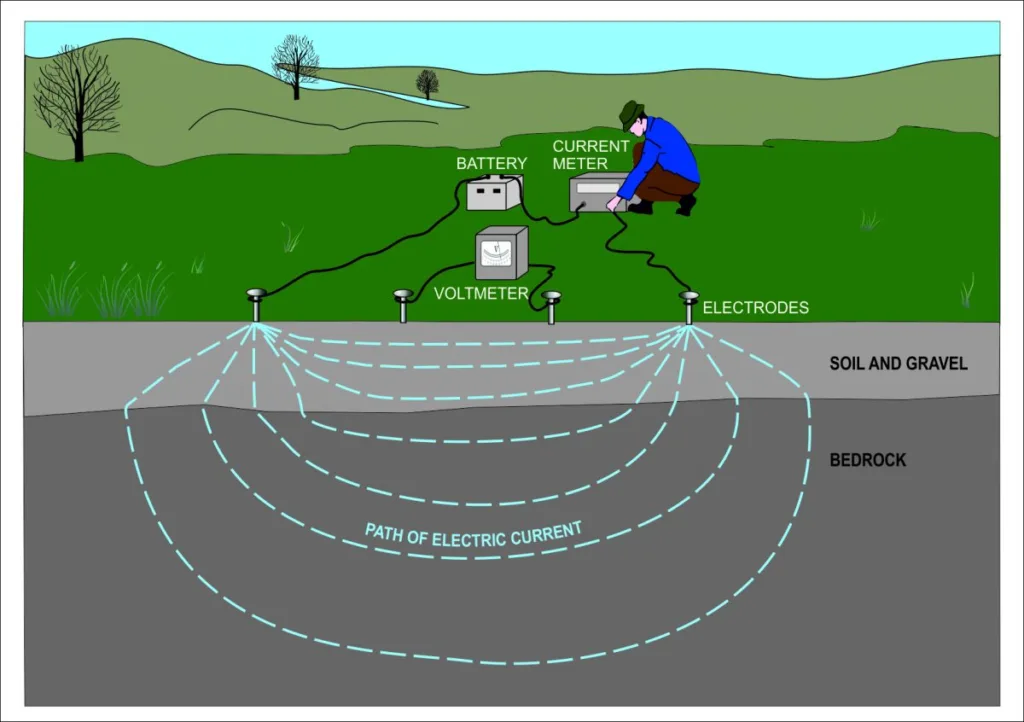
Electrical resistivity surveys are geophysical techniques used to measure the subsurface electrical resistivity of soils and rocks. The method involves injecting an electrical current into the ground and measuring the resulting voltage. By understanding how materials resist the flow of electrical current, geophysicists can infer the subsurface composition and identify features such as bedrock, water tables, and geological structures. This information is crucial in various fields, including environmental studies, civil engineering, archaeology, and hydrogeology.
The basic principle is that different materials have different electrical resistivities. For example, materials like clay and water typically have low resistivity, while rocks and dry soils have higher resistivity. By mapping these variations in resistivity, geophysicists can create subsurface models, aiding in the characterization of geological structures and helping in the identification of potential hazards or resources.
Brief History and Development:
The roots of electrical resistivity surveys can be traced back to the late 19th century when scientists began experimenting with the electrical properties of materials. However, it wasn’t until the mid-20th century that the method gained prominence in geophysics.
- Early Years (Late 19th to Early 20th Century): The groundwork for electrical resistivity surveys was laid by the pioneering work of scientists such as Conrad Schlumberger and his brother Marcel Schlumberger. In the 1920s, they developed the Schlumberger array, a configuration still widely used in resistivity surveys today. The Schlumberger brothers’ contributions marked the beginning of systematic electrical resistivity measurements for subsurface exploration.
- Mid-20th Century Advancements: The mid-20th century saw significant advancements in instrumentation and methodologies. The development of more sophisticated equipment allowed for more accurate and efficient data collection. This period also witnessed the adaptation of resistivity surveys for various applications, ranging from mineral exploration to environmental studies.
- Modern Era: In recent decades, technological advancements, including computer modeling and data inversion techniques, have enhanced the accuracy and efficiency of electrical resistivity surveys. Advanced instrumentation and software tools have made it possible to conduct surveys in diverse terrains and to interpret complex subsurface structures.
Today, electrical resistivity surveys continue to be a valuable tool in geophysics, offering insights into subsurface conditions that are essential for a wide range of applications, from environmental site assessments to groundwater exploration and geotechnical investigations. The method’s non-invasive nature and ability to provide detailed subsurface information make it a crucial component of modern geophysical exploration and engineering practices.
Basic Principles of Electrical Resistivity
- Ohm’s Law and its Application to Electrical Resistivity:
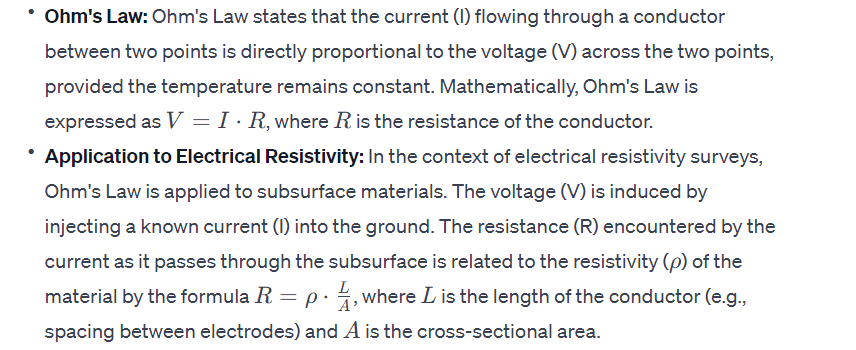
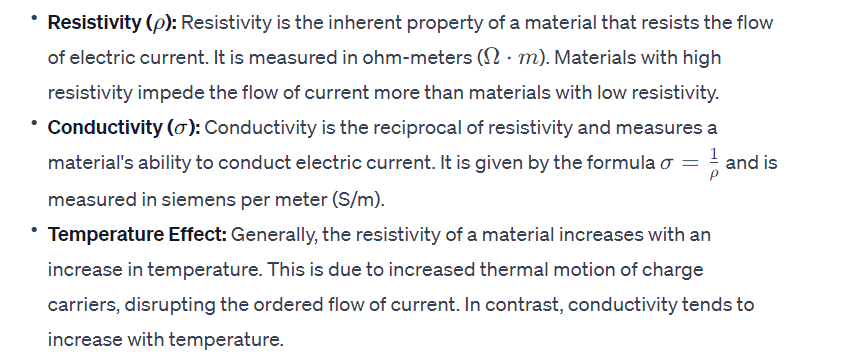
- Relationship Between Resistivity, Conductivity, and Temperature:
- Factors Influencing Resistivity in Geological Materials:
- Porosity: The presence of pores or void spaces within geological materials affects their resistivity. Typically, materials with high porosity, such as sediments and soils, tend to have lower resistivity due to the presence of fluids.
- Water Content: The resistivity of materials is highly influenced by the amount and type of fluids present. Water, being a good conductor, significantly reduces the resistivity of the subsurface. Conversely, dry soils or rocks tend to have higher resistivity.
- Mineral Composition: The type and arrangement of minerals in geological materials impact resistivity. For example, minerals with metallic or conductive properties contribute to lower resistivity, while insulating minerals increase resistivity.
- Temperature: As mentioned earlier, temperature can influence resistivity. However, the effect may vary depending on the specific properties of the material.
- Pressure: In some cases, high pressures can affect resistivity, particularly in materials with high porosity.
Understanding these factors is crucial for accurately interpreting resistivity data obtained from surveys and for making informed assessments about subsurface conditions and geological structures.
Instrumentation in Electrical Resistivity Surveys
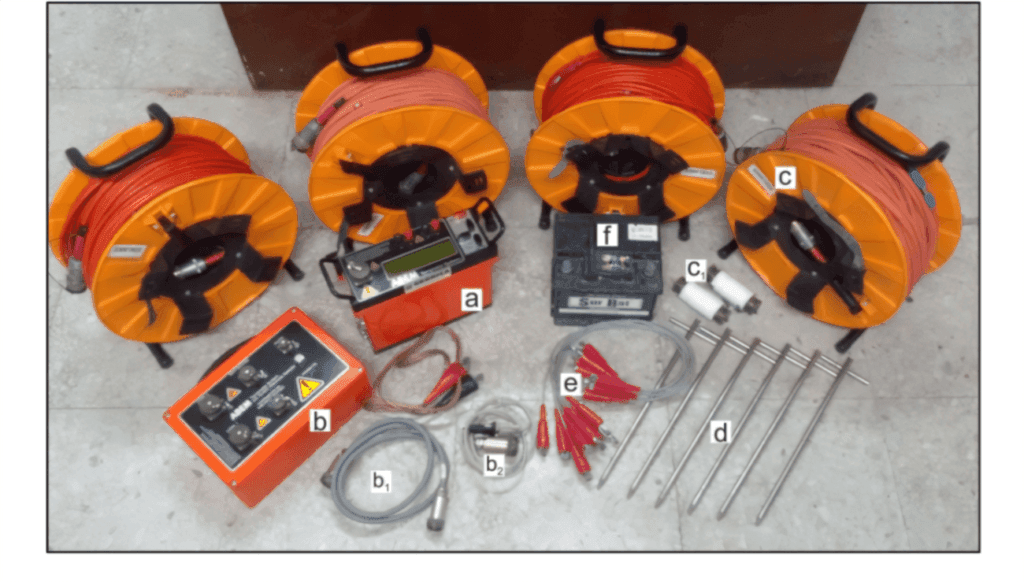
Electrical resistivity surveys use specialized equipment to inject electrical current into the ground and measure the resulting potential difference. The key components of the instrumentation include:
- Power Source:
- Provides the electrical current used in the survey.
- Common power sources include batteries or generators, depending on the scale and duration of the survey.
- Current Injectors:
- Electrodes or electrode arrays used to introduce electrical current into the ground.
- These electrodes are strategically placed on the Earth’s surface or inserted into the ground.
- Potential Measurement System:
- Consists of electrodes or electrode arrays used to measure the voltage potential created by the injected current.
- The potential difference is measured at various points, allowing the calculation of subsurface resistivity.
- Data Acquisition System:
- Collects and records the measurements obtained from potential electrodes.
- Modern systems often include digital recorders and computer interfaces for efficient data processing.
Electrode Configurations and Their Applications:
Different electrode configurations are employed in electrical resistivity surveys, each offering unique advantages for specific geological conditions. Some common configurations include:
- Wenner Array:
- Configuration: Four electrodes arranged in a straight line, with equal spacing between adjacent electrodes.
- Application: Suitable for general resistivity surveys and commonly used for initial subsurface investigations.
- Schlumberger Array:
- Configuration: Two outer current electrodes and two inner potential electrodes, with variable spacing between them.
- Application: Ideal for detailed surveys, as the variable spacing allows for focused investigation of specific depths.
- Dipole-Dipole Array:
- Configuration: One pair of current electrodes and another pair of potential electrodes, with fixed separation distances.
- Application: Well-suited for deep subsurface investigations, providing good depth penetration.
- Pole-Dipole Array:
- Configuration: One current electrode and one potential electrode, with variable separation distances.
- Application: Used for deep profiling and can provide information on lateral changes in resistivity.
- Gradient Array:
- Configuration: A series of potential electrodes along a straight line, with a fixed separation distance.
- Application: Useful for detecting lateral changes in resistivity, emphasizing sensitivity to near-surface variations.
Current and Potential Electrode Placement:
- Current Electrodes:
- Placed in a line or along a profile, injecting electrical current into the ground.
- Typically positioned at the extremities of the survey line.
- Potential Electrodes:
- Used to measure the voltage potential created by the injected current.
- Positioned at various points along the survey line, with spacing determined by the chosen electrode configuration.
- Spacing and Depth:
- Electrode spacing and depth depend on the specific goals of the survey.
- Larger electrode separations provide information about deeper subsurface layers, while smaller separations offer higher resolution for shallow features.
- Multiple Configurations:
- In a comprehensive survey, multiple electrode configurations may be used to gather complementary information and enhance the overall understanding of subsurface conditions.
Understanding the principles of electrode configurations and their applications is essential for designing effective electrical resistivity surveys tailored to the geological context and survey objectives.
Field Procedures in Electrical Resistivity Surveys

Planning and Preparation:
- Define Objectives:
- Clearly outline the goals and objectives of the resistivity survey. This could include mapping subsurface geological structures, locating groundwater, or assessing environmental conditions.
- Site Selection:
- Choose the survey area based on the objectives and geological context. Consider factors such as accessibility, topography, and potential interference from nearby structures.
- Geological and Site Information:
- Gather existing geological and site information to aid in survey planning. Geological maps, borehole logs, and previous survey data can provide valuable insights.
- Instrument Calibration:
- Calibrate survey instruments to ensure accurate measurements. This involves checking and adjusting the instrument settings, as well as verifying the integrity of electrodes.
- Safety Considerations:
- Identify potential safety hazards at the survey site and implement safety protocols. This may include awareness of power lines, unstable terrain, or adverse weather conditions.
Survey Design and Layout:
- Electrode Configuration Selection:
- Choose the appropriate electrode configuration(s) based on survey objectives and geological conditions. Consider the depth of investigation, resolution requirements, and potential challenges.
- Grid or Line Layout:
- Determine whether a grid or line layout is more suitable for the survey. Grid layouts are effective for mapping large areas, while line layouts are often used for detailed profiling.
- Electrode Spacing and Array Geometry:
- Determine electrode spacing and array geometry based on the chosen configuration and the desired depth of investigation. Adjustments may be made to optimize the survey for specific geological features.
- Survey Line Orientation:
- Select the orientation of survey lines based on the geological strike, expected structures, or project requirements. The orientation can influence the detection of certain geological features.
- Measurement Stations:
- Identify the locations of measurement stations, ensuring that they cover the entire survey area systematically. Stations should be marked using stakes, flags, or GPS coordinates for accurate data collection.
Data Acquisition Techniques:
- Current and Potential Electrode Placement:
- Install current electrodes at the ends of survey lines and potential electrodes along the survey lines according to the chosen electrode configuration.
- Current Injection:
- Inject a known electrical current into the ground through the current electrodes. Ensure that the current injection is stable and controlled.
- Potential Measurement:
- Measure the voltage potential between potential electrodes. Record data systematically, following the chosen electrode configuration and spacing.
- Data Recording:
- Record data at each measurement station using a data logger or digital recording system. Document relevant information, such as electrode spacing, instrument settings, and environmental conditions.
- Survey Progression:
- Systematically progress through the survey lines or grid, maintaining consistent electrode spacing and following the predetermined layout.
- Quality Control:
- Implement quality control measures to identify and address any issues during data acquisition. This may include checking for consistent electrode contact, monitoring instrument performance, and addressing potential interference.
- Repeat Measurements:
- In some cases, repeating measurements or using multiple configurations can enhance data reliability and accuracy.
- Post-Processing:
- After field data collection, perform necessary post-processing steps, including data inversion and interpretation, to generate subsurface resistivity models.
Effective planning, careful survey design, and meticulous data acquisition techniques are crucial for obtaining accurate and meaningful results in electrical resistivity surveys. Regular checks and adherence to best practices contribute to the success of the fieldwork.
Data Processing and Analysis in Electrical Resistivity Surveys
Raw Data Processing and Quality Control:
- Data Verification:
- Check the collected raw data for errors, inconsistencies, or anomalies. Verify the correctness of electrode configurations, spacing, and instrument settings.
- Noise Removal:
- Identify and filter out noise from the raw data. This may include eliminating outliers, correcting for instrument drift, or addressing any interference during data acquisition.
- Calibration Corrections:
- Apply any necessary calibration corrections to account for variations in instrument performance. This ensures that the recorded data accurately represents subsurface resistivity variations.
- Quality Control Checks:
- Perform quality control checks on the processed data to ensure its reliability. This includes reviewing electrode contact quality, assessing data repeatability, and addressing any issues that may affect the accuracy of the results.
- Data Presentation:
- Present the processed data in a clear and organized format, often as pseudosections or profiles, which visually represent the distribution of resistivity values along survey lines or within a survey area.
Inversion Methods for Subsurface Resistivity Models:
- Introduction to Inversion:
- Inversion is the process of transforming field data into a subsurface resistivity model. It is an iterative mathematical technique that aims to find the best-fitting model that explains the observed data.
- Forward Modeling:
- Create a forward model that simulates the expected resistivity distribution based on initial assumptions about the subsurface. This model is then compared to the field data.
- Inverse Modeling:
- Adjust the parameters of the forward model iteratively until the calculated data match the observed data as closely as possible. This involves minimizing the misfit between the observed and calculated data.
- Regularization:
- Apply regularization techniques to stabilize the inversion process and prevent unrealistic or erratic variations in the resulting resistivity model. Common regularization methods include Tikhonov regularization.
- Choice of Inversion Method:
- Select an appropriate inversion method based on the nature of the survey, the complexity of the subsurface, and the available computational resources. Common methods include smooth or blocky inversion techniques.
- Resolution and Uncertainty Assessment:
- Evaluate the resolution of the inversion results to understand the level of detail that can be reliably resolved in the subsurface model. Additionally, assess the uncertainty associated with the inverted resistivity values.
Interpretation of Resistivity Models:
- Visual Analysis:
- Visualize the resistivity model using contour plots, cross-sections, or 3D renderings. This aids in the identification of geological features such as bedrock, water tables, and subsurface structures.
- Comparison with Geological Information:
- Compare the resistivity model with existing geological information to validate and refine interpretations. Geological knowledge can help correlate resistivity variations with specific geological units.
- Cross-Validation:
- Cross-validate the resistivity model by comparing it with independent data or complementary geophysical methods, if available. This helps validate the reliability of the results.
- Integration with Other Data:
- Integrate resistivity models with data from other geophysical methods, borehole information, or geological surveys to gain a more comprehensive understanding of the subsurface.
- Uncertainty Analysis:
- Evaluate uncertainties associated with the resistivity model, considering factors such as data errors, inversion parameters, and limitations of the method. This helps communicate the reliability of the results.
- Report Generation:
- Present the final interpretation in a comprehensive report, including details about the survey design, data processing, inversion parameters, and key findings. Clearly communicate the limitations and uncertainties associated with the resistivity model.
By following these steps in data processing, inversion, and interpretation, geophysicists can extract meaningful information from electrical resistivity surveys, leading to valuable insights into subsurface conditions and geological structures.
Applications of Electrical Resistivity Surveys

- Environmental Site Assessments:
- Identify and characterize subsurface contamination, such as leachate plumes from landfills or underground storage tanks. Resistivity surveys help delineate the extent and depth of contaminated zones.
- Groundwater Exploration:
- Locate and map groundwater resources by assessing subsurface geology and identifying aquifers. Resistivity surveys are useful for determining the depth, thickness, and lateral extent of water-bearing formations.
- Engineering and Geotechnical Investigations:
- Evaluate subsurface conditions for construction projects, infrastructure development, and slope stability assessments. Resistivity surveys assist in mapping variations in soil and rock properties.
- Mineral Exploration:
- Map and delineate ore bodies and mineral deposits by identifying variations in resistivity associated with different rock types. This is valuable for the mining industry in targeting exploration efforts.
- Archeological Investigations:
- Aid in the detection of buried structures, artifacts, or archaeological features by identifying variations in resistivity. Resistivity surveys can be instrumental in non-invasive archaeological site assessments.
- Hydrogeological Studies:
- Assess the distribution and movement of groundwater in aquifers, helping to understand hydrological processes. Resistivity surveys contribute to modeling subsurface flow patterns and understanding water table dynamics.
- Civil and Environmental Engineering:
- Investigate and characterize subsurface conditions for civil engineering projects, such as dam construction, tunneling, and foundation design. Resistivity surveys provide insights into soil and rock properties.
- Monitoring and Remediation of Contaminated Sites:
- Monitor changes in subsurface resistivity over time to assess the effectiveness of remediation efforts at contaminated sites. This is crucial for ongoing environmental management.
- Geothermal Resource Exploration:
- Identify and characterize subsurface thermal anomalies and geothermal reservoirs. Resistivity surveys contribute to understanding the distribution of subsurface temperatures and potential geothermal energy sources.
- Landslide and Earthquake Hazard Assessment:
- Evaluate the stability of slopes and assess the risk of landslides. Resistivity surveys can detect subsurface structures that may influence slope stability, contributing to hazard assessment.
- Mapping Geological Structures:
- Monitoring and Managing Water Resources:
- Monitor changes in groundwater levels and flow patterns over time. Resistivity surveys contribute to the ongoing management of water resources and aid in developing sustainable water supply strategies.
- Infrastructure Planning and Management:
- Assess subsurface conditions for urban planning, transportation infrastructure projects, and the maintenance of existing infrastructure. Resistivity surveys help identify potential challenges and inform engineering decisions.
- Oil and Gas Exploration:
- In some cases, resistivity surveys are used in combination with other geophysical methods for hydrocarbon exploration, helping to identify subsurface structures associated with potential oil and gas reservoirs.
The versatility of electrical resistivity surveys makes them a valuable tool across various disciplines, providing critical subsurface information for informed decision-making in environmental, geological, engineering, and archaeological applications.
 Methods")
")


